Salesforce, a leader in customer relationship management (CRM), offers robust tools for managing and analyzing data, among which reports are fundamental. Salesforce reports allow users to gain insights into their data, enabling better decision-making and business strategies.
This blog will explore Salesforce reports, their core features, how to create them, and the four different Salesforce report types. Let’s embark on this informative journey to understand Salesforce report types comprehensively.
What are Salesforce Reports?
Salesforce reports are essential tools that help users collect, analyze, and present data stored within Salesforce. These reports enable businesses to track performance, identify trends, and make data-driven decisions. Salesforce reports can be customized to meet an organization’s needs, ensuring the information is relevant and actionable.

Core Features of Salesforce Reports
Salesforce reports come with many features that enhance their functionality and usefulness. Here are some core features explained in detail:
1. Customization
- Filter Criteria: Salesforce reports allow users to set filter criteria to include only the data that meets specific conditions. Filters can be applied based on fields, date ranges, and other parameters, ensuring that the report focuses on the most relevant data.
- Groupings and Summarizations: Users can group data by specific fields, such as account, opportunity stage, or region. Summarizations provide aggregate values, like totals or averages, making it easier to analyze large datasets.
2. Real-Time Data
- Up-to-date Information: Salesforce reports pull data directly from the Salesforce database, ensuring that the information is current and reflects the latest updates. This real-time capability is crucial for making timely business decisions.
3. Interactive Dashboards
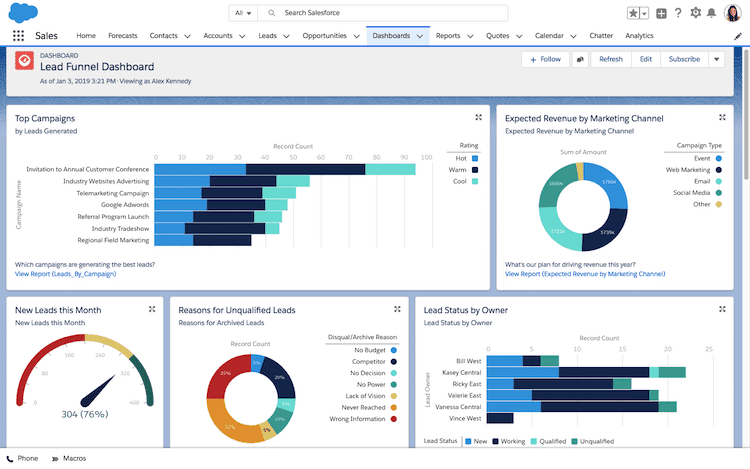
- Visual Representation: Reports can be displayed in interactive dashboards, which provide a visual representation of the data through charts, graphs, and tables. Dashboards make it easier to spot trends and anomalies at a glance.
- Drill-Down Capability: Users can click on elements within a dashboard to drill down into more detailed reports, allowing for deeper data analysis.
4. Sharing and Collaboration
- Report Sharing: Salesforce reports can be shared with specific users or groups, ensuring that relevant stakeholders can access critical information. Sharing settings can be configured to control who can view or modify the reports.
- Collaboration Tools: Users can collaborate on reports by adding comments and annotations, making it easier to discuss insights and action items directly within the Salesforce platform.
5. Scheduling and Automation
- Automated Delivery: Reports can be scheduled at specific times and automatically emailed to users. This feature ensures that stakeholders receive regular updates without manually running the reports.
- Triggered Reports: Reports can be set to run based on specific triggers, such as creating a new record or a change in status. This automation helps keep the team informed about important events.
How To Create Reports in Salesforce
The intuitive report builder makes creating reports in Salesforce a straightforward process. Here’s a step-by-step guide:
Navigate to the Reports Tab
- Go to the Reports tab in Salesforce. If you don’t see it, it might be hidden under the “More” dropdown menu.
Click on “New Report.”
- Click the “New Report” button to start creating a new report. Salesforce will prompt you to select a report type.
Choose a Report Type
- Based on the data you want to analyze, select the appropriate report type. Salesforce offers several pre-defined report types, which we will discuss in detail later.
Define the Report Filters
- Set the filter criteria to specify which records should be included in the report. You can filter by fields, date ranges, and other conditions.
Group and Summarize Data
- Group the data by specific fields to organize the report logically. Add summarizations to calculate totals, averages, or other aggregate values.
Select Report Format
- Choose the report format, such as tabular, summary, matrix, or joined, based on how you want the data presented.
Add Charts and Visuals
- Enhance the report with charts and graphs to represent the data visually. This step is beneficial for creating dashboards.
Save and Run the Report
- Save the report and run it to see the results. You can also schedule the report to run regularly or share it with other users.
The 4 Different Salesforce Report Types
Salesforce offers four primary report types, each suited for different kinds of data analysis. Understanding these Salesforce report types will help you choose the correct format for your needs:
1. Tabular Reports
Tabular reports are the simplest type of Salesforce reports. They display data in a table format, similar to a spreadsheet, with each row representing a record and columns representing fields.
- Use Cases: These reports are ideal for lists of records, such as contact lists, product inventories, or simple data exports. They are unsuitable for complex analysis since they need more grouping and summarization capabilities.
- Limitations: Tabular reports cannot be used to create dashboards and do not support groupings or summaries.
2. Summary Reports
Summary reports offer more complexity than tabular reports. They allow data grouping and provide summary calculations like totals, averages, and counts.
- Use Cases: These reports are perfect for hierarchical data representation, such as sales by region, opportunities by stage, or cases by priority. They are commonly used in dashboards to display aggregated data.
- Features: Summary reports support grouping by multiple fields and offer various summarization options, making them versatile for detailed analysis.
3. Matrix Reports
Matrix reports are similar to pivot tables in spreadsheets. They allow data to be grouped and summarized by both rows and columns.
- Use Cases: These reports are ideal for comparing related totals, such as sales performance across regions and products, or service cases by status and priority. They provide a comprehensive view of the data from multiple perspectives.
- Features: Matrix reports support complex groupings and various summarization levels, making them powerful for in-depth data analysis.
4. Joined Reports
Joined reports combine multiple reports into a single view, allowing users to compare data from different report types.
- Use Cases: These reports are useful for comprehensive analysis that requires data from various sources, such as comparing sales and support metrics or viewing customer interactions across different touchpoints.
- Features: Joined reports allow multiple report blocks with their own filter criteria, providing flexibility to combine and compare disparate datasets.

Understanding Salesforce report types is crucial for leveraging the full potential of Salesforce’s reporting capabilities. Each report type serves different analytical needs, from simple data lists to complex comparisons and summaries. By mastering these report types, You can make better business decisions by learning more about your data.
Salesforce reports are powerful tools for data analysis and presentation. Their core features, such as customization, real-time data, interactive dashboards, sharing and collaboration, and scheduling and automation, make them indispensable for modern businesses.
By following the steps to create reports and utilizing the appropriate Salesforce report types—tabular, summary, matrix, and joined—you can harness Salesforce’s full power to drive your organization’s success.
Whether you’re a Salesforce newbie or a seasoned user, understanding and effectively using Salesforce report types can significantly enhance your data management and decision-making capabilities. So dive in, explore the various report types, and transform your data into actionable insights today!

